 μStats
Status line
Is all well?
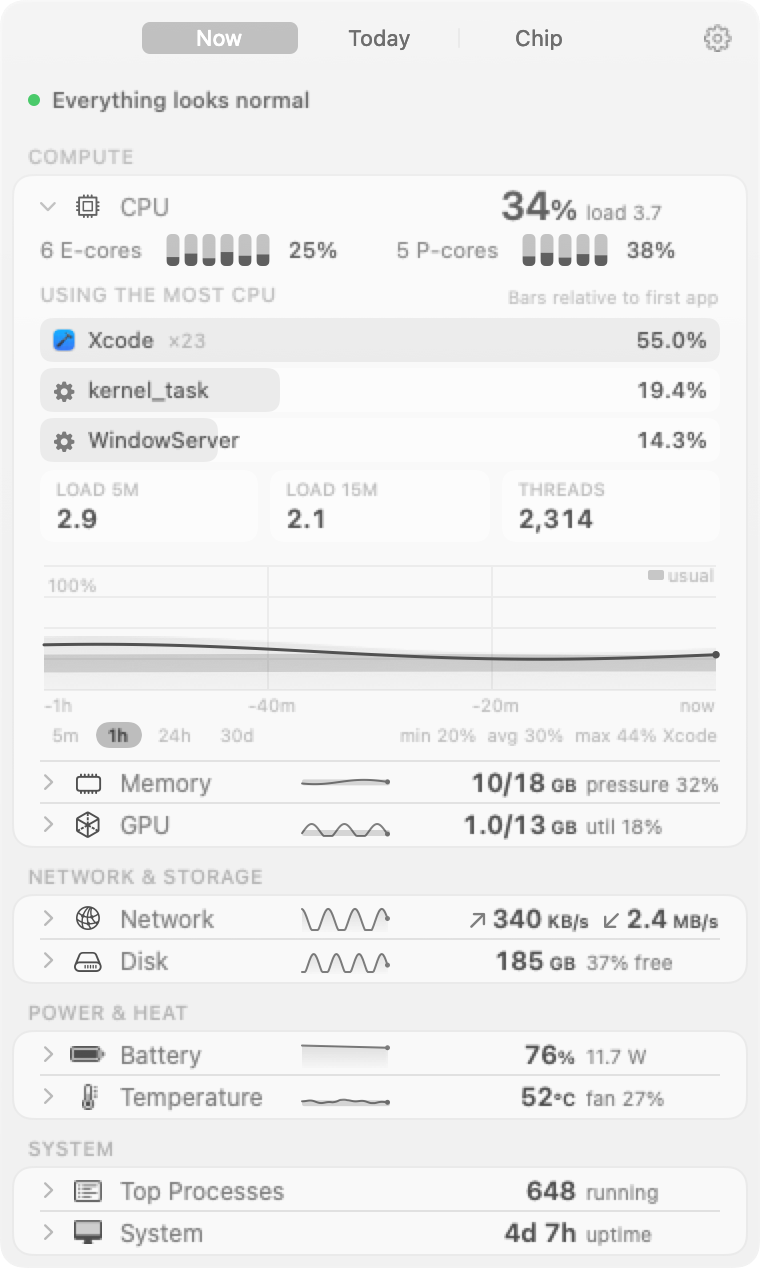
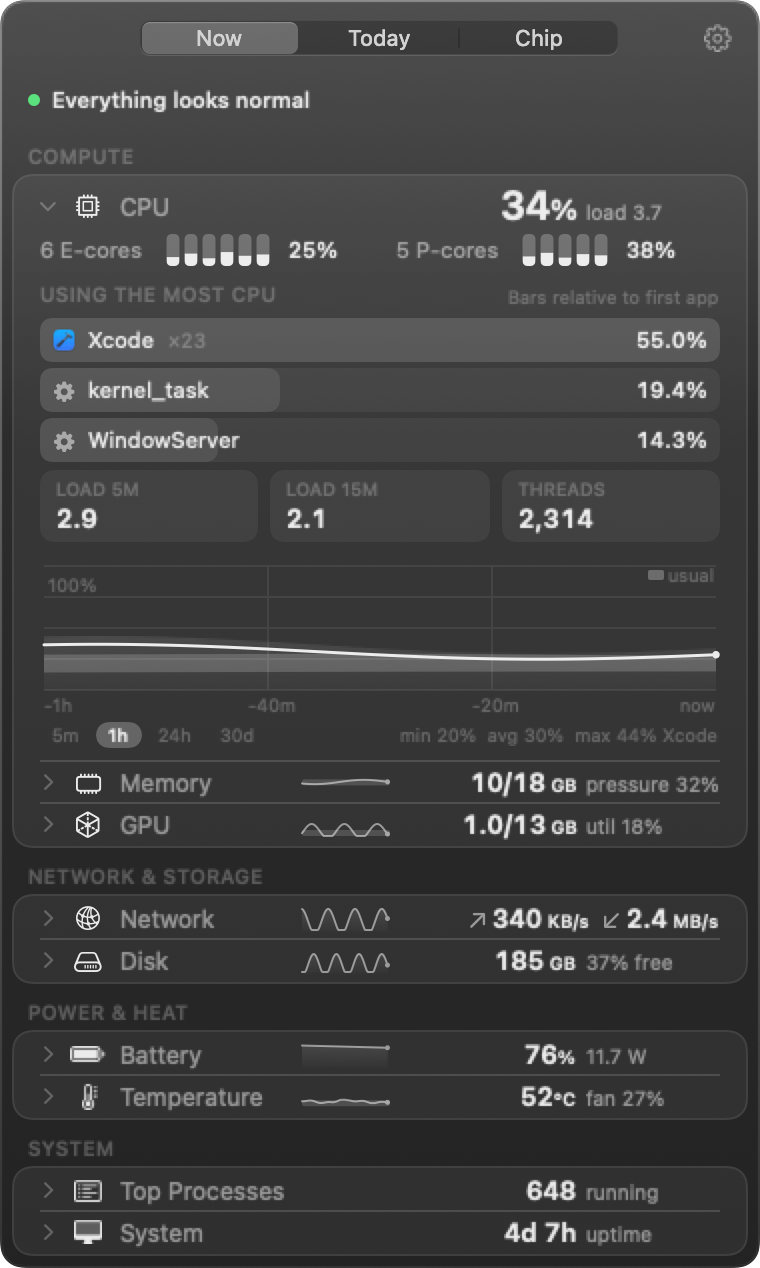
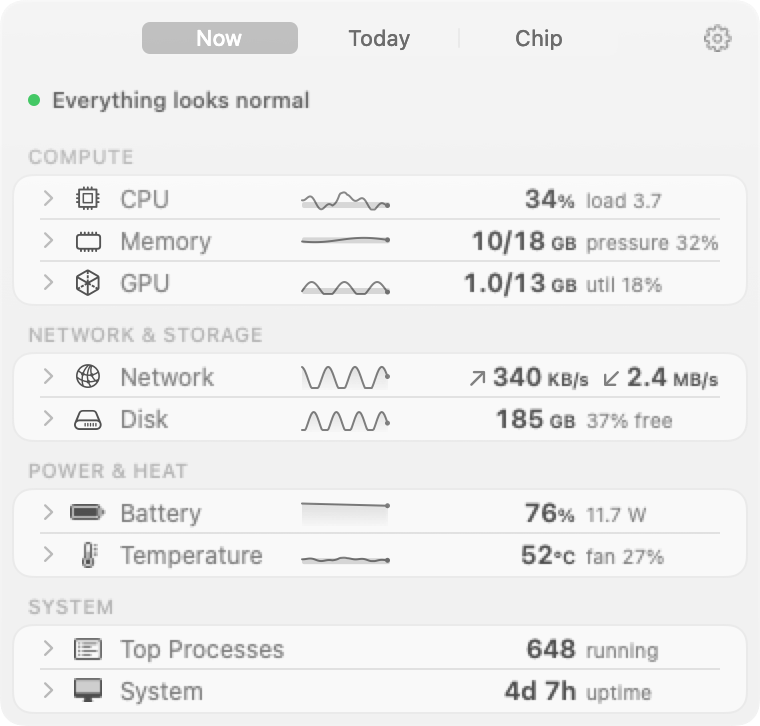
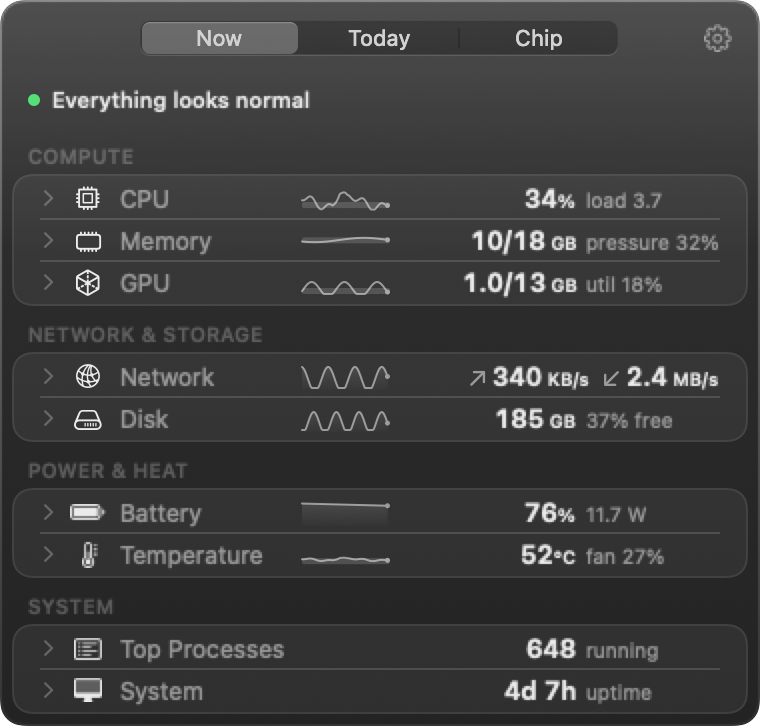
The first line of the panel says so in words. When one row needs attention, the others step back. If all is calm now, the line says what happened while the panel was closed.
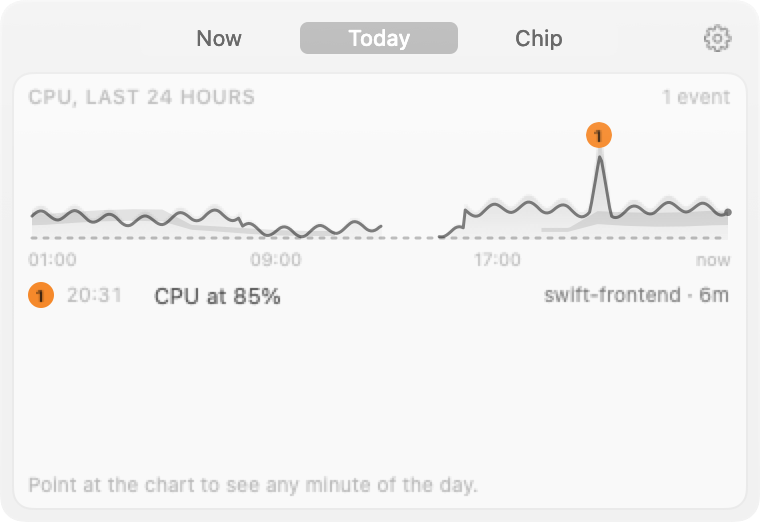
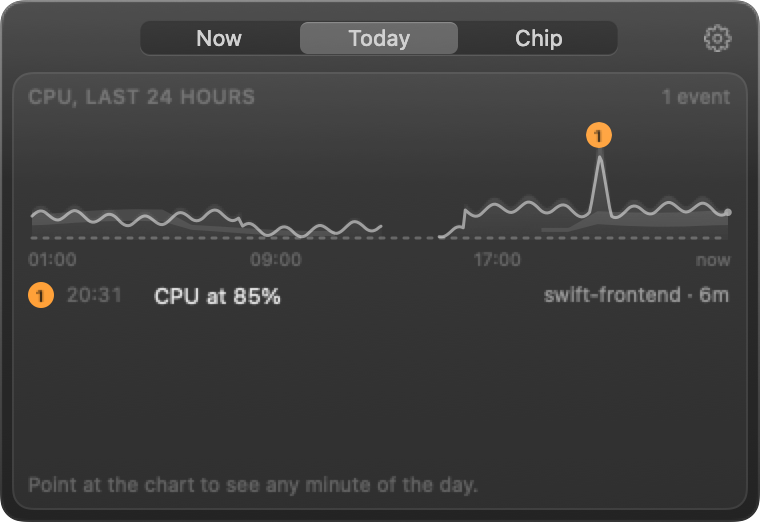
CPU peaked at 85% at 20:31 swift-frontend
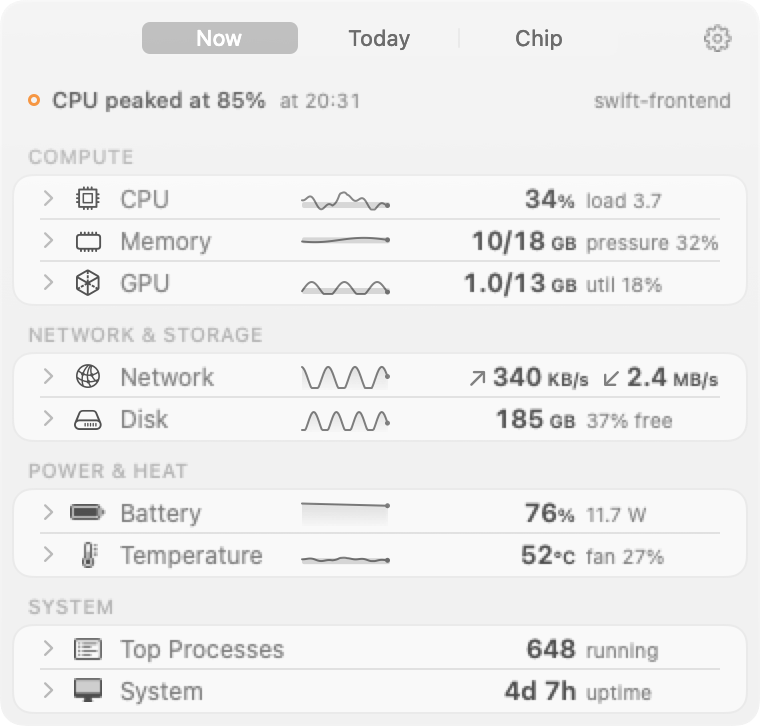
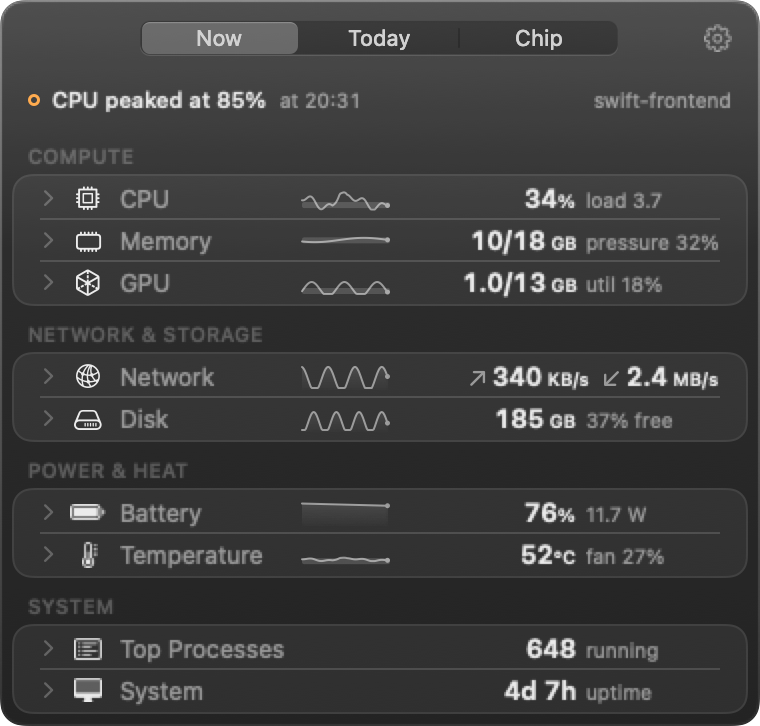
μStats is a lightweight system monitor for the menu bar. It tells you if all is well, which app is the cause when it is not, and what is usual for this Mac at this hour.
Free and open source (MIT). macOS 14 or later, Apple silicon and Intel.
Three questions, one second
Status line
The first line of the panel says so in words. When one row needs attention, the others step back. If all is calm now, the line says what happened while the panel was closed.
CPU peaked at 85% at 20:31 swift-frontend
Apps, not processes
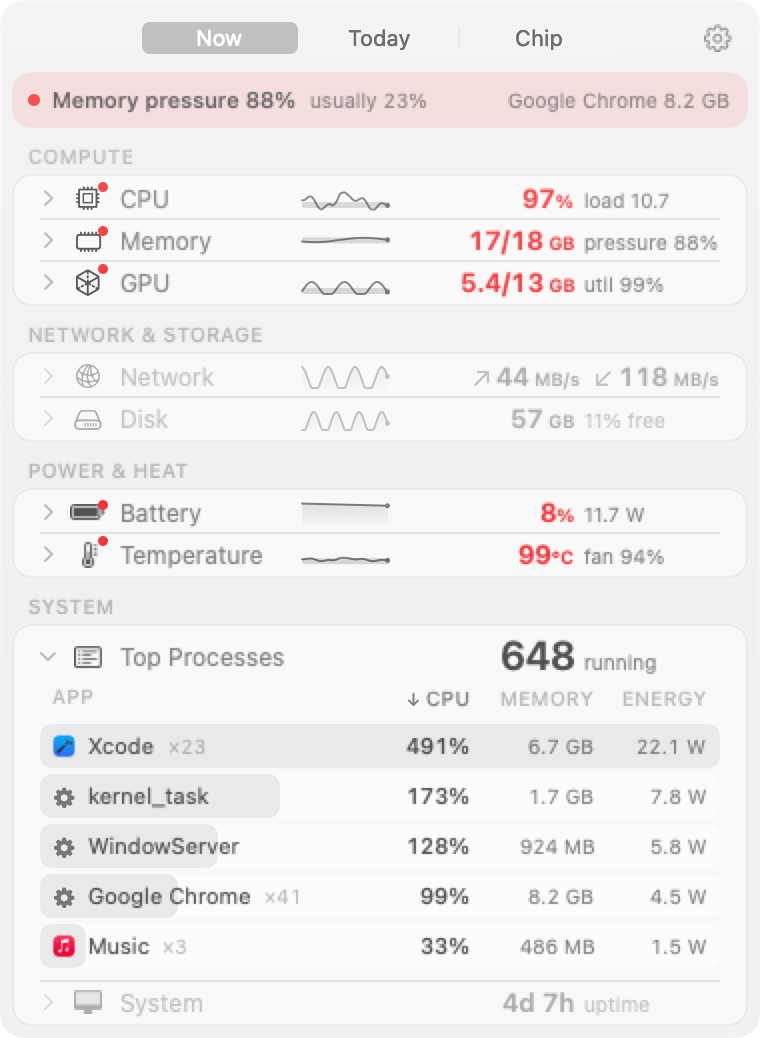
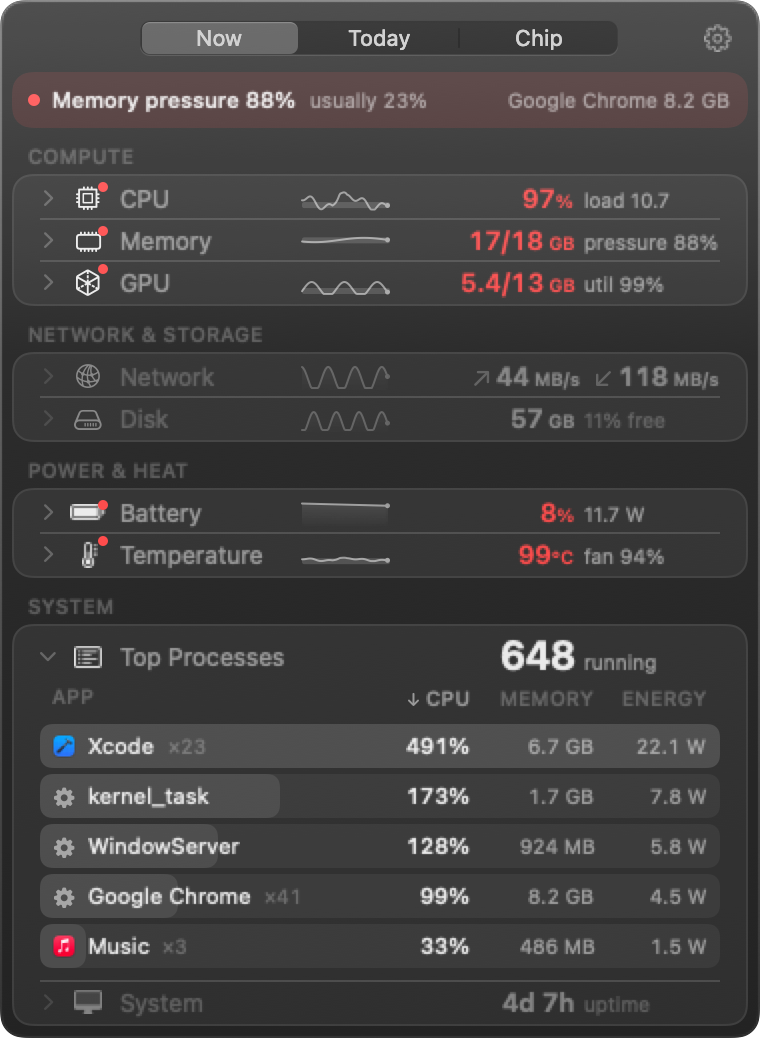
μStats adds up every process of an app. Forty browser helpers become one row, with CPU, memory and energy side by side. A click on a column ranks the list.
Google Chrome ×41 99% 8.2 GB 4.5 W
This Mac's usual
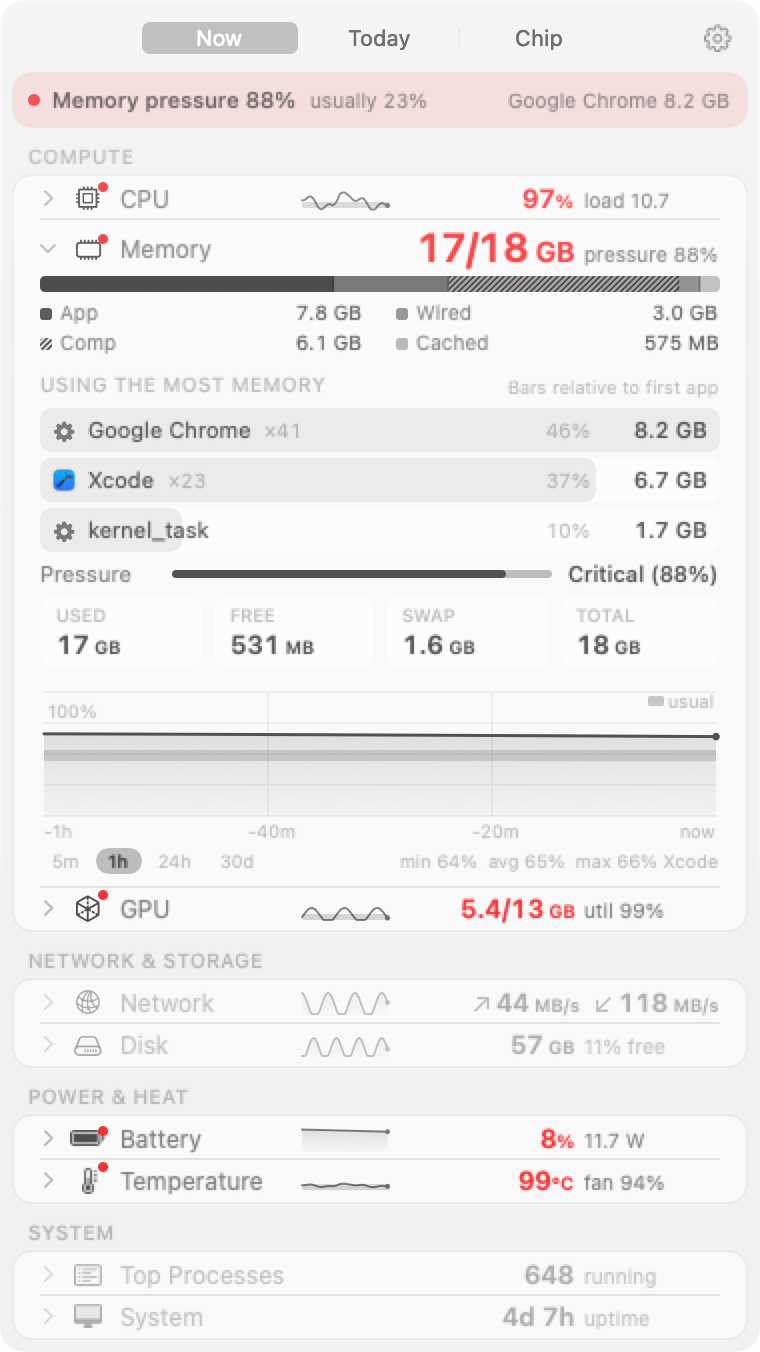
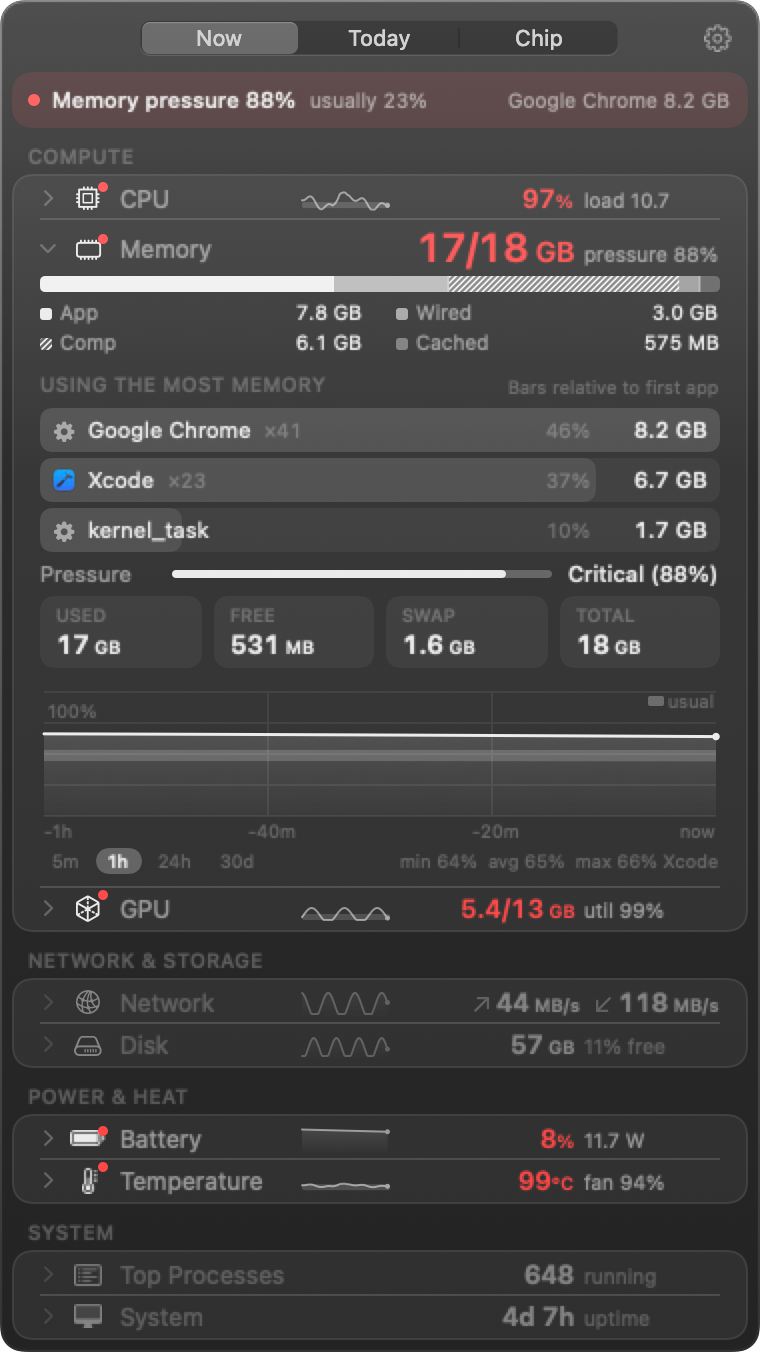
μStats learns from 30 days of history where this Mac usually sits at each hour. Charts draw that range, and the status line quotes it beside the reading.
Memory pressure 88% usually 23%
The views
Menu bar
Rings, bars, text, graphs and indicators, in one item or several. Six colour sets for the rings, or your own colours.








Chip
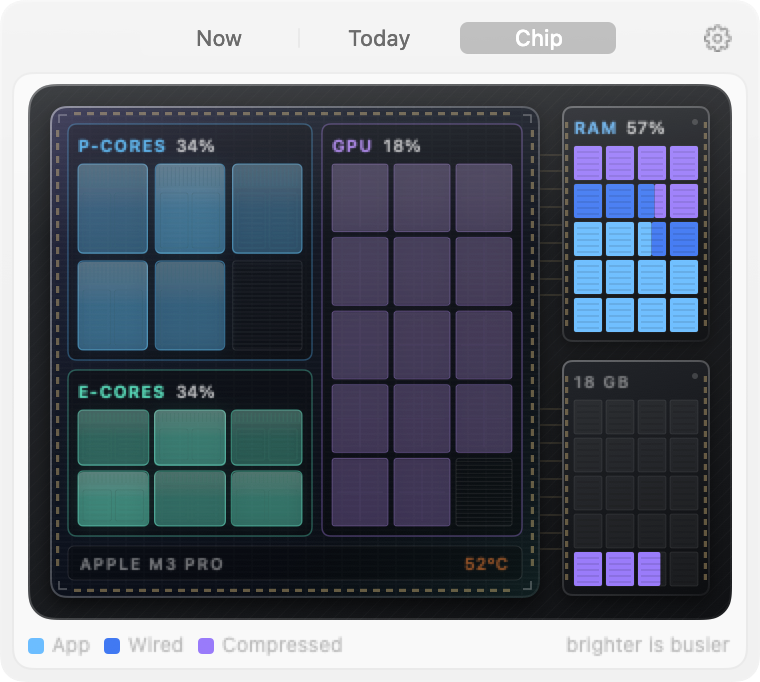
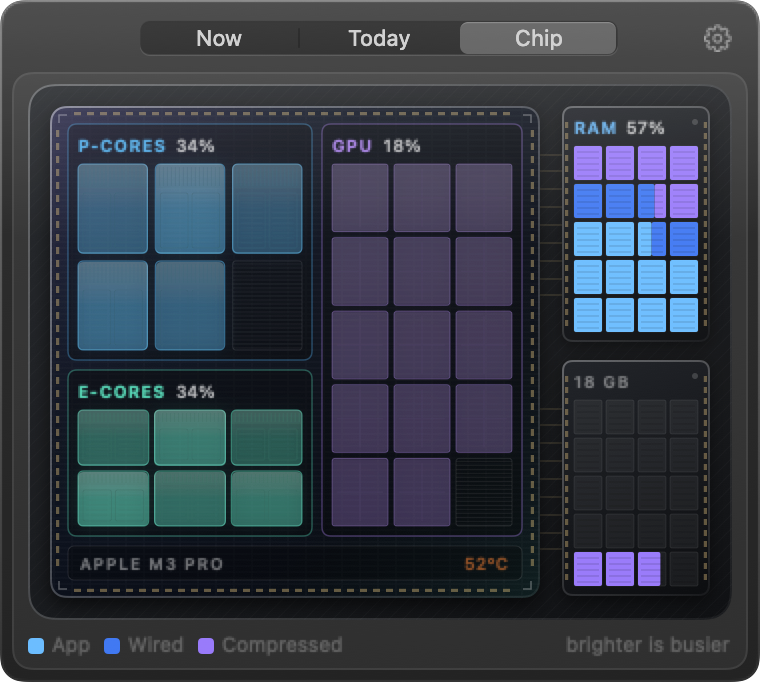
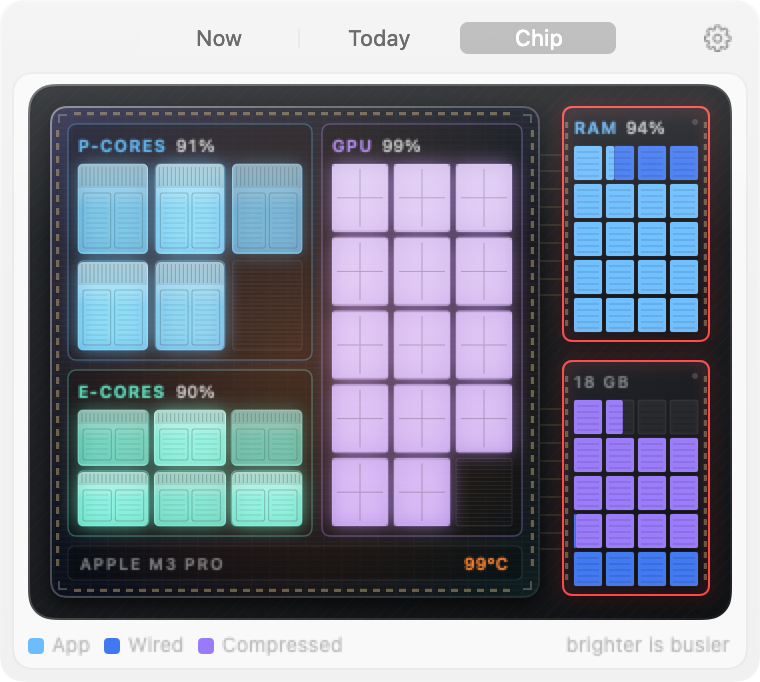
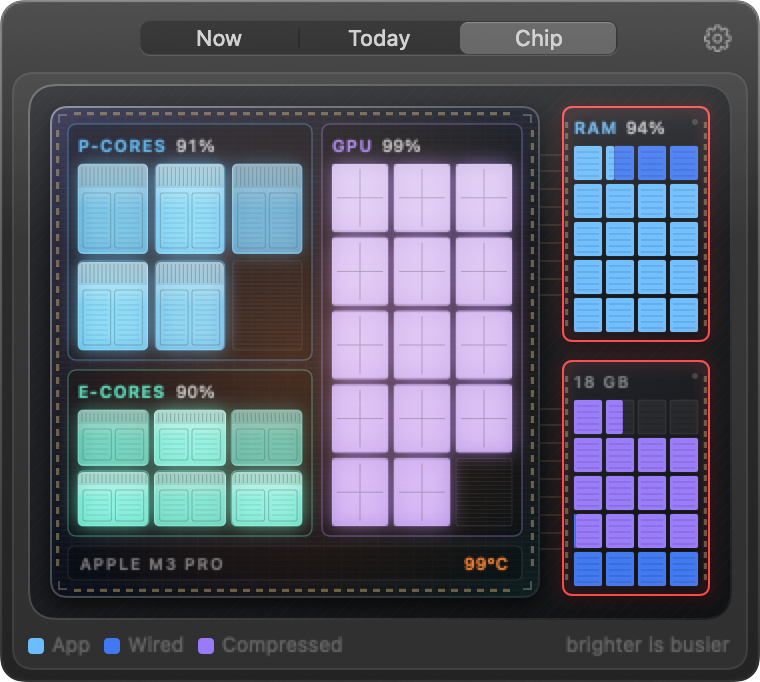
The die with its cores, the GPU and the memory modules beside it. Every core glows with its own load.
Today
Drag across the chart to see that minute and the app on top.
Panel
And also
mustats status, mustats top, JSON output for scripts.Cost to your Mac
Under 1% of one core on average and about 23 MB of memory with the panel closed, measured on an M4 Pro.
Price
Free. No account, no ads. MIT license.
Your data
They stay on your Mac. No analytics. The app looks for updates on GitHub and, with the Network details open, times a request to Apple. The public IP lookup is off by default.
Requires
macOS 14 (Sonoma) or later. Apple silicon and Intel.
Updates
Inside the app, verified with the project's signing key.
Languages
English and Italian.
Install
Homebrew
The simplest way. Homebrew also removes the first-launch block.
brew install --cask danesed/tap/mustats
Direct download
Step 3 is needed because μStats is not notarized by Apple yet.
Yes. Every feature is free and the source is open under the MIT license. If you want, you can support the project with a star or a donation.
Under 1% of one core on average and about 23 MB with the panel closed, on an M4 Pro. μStats reads less often when the Mac is calm, when the menu bar is covered and in Low Power Mode. The project's tests fail if a hot path goes over its time budget.
The download contains code for Apple silicon and for Intel. The Intel build has not been tested on a real Intel Mac yet: if you try it, open an issue on GitHub and say how it went.
Because the app is not notarized by Apple yet. With Homebrew the block does not appear. With the direct download, follow step 3 above.
μStats keeps 30 days of history on your Mac. For each hour it compares the current reading with the same hour on the earlier days. It needs at least 7 days of history.
With Homebrew: brew uninstall --cask mustats. Otherwise quit μStats and move the app to the Trash.
Support μStats
μStats is built in spare time. The simplest way to help costs nothing: a star on GitHub.
Thanks for downloading. If μStats earns a place in your menu bar, a star helps others find it.
★ Star